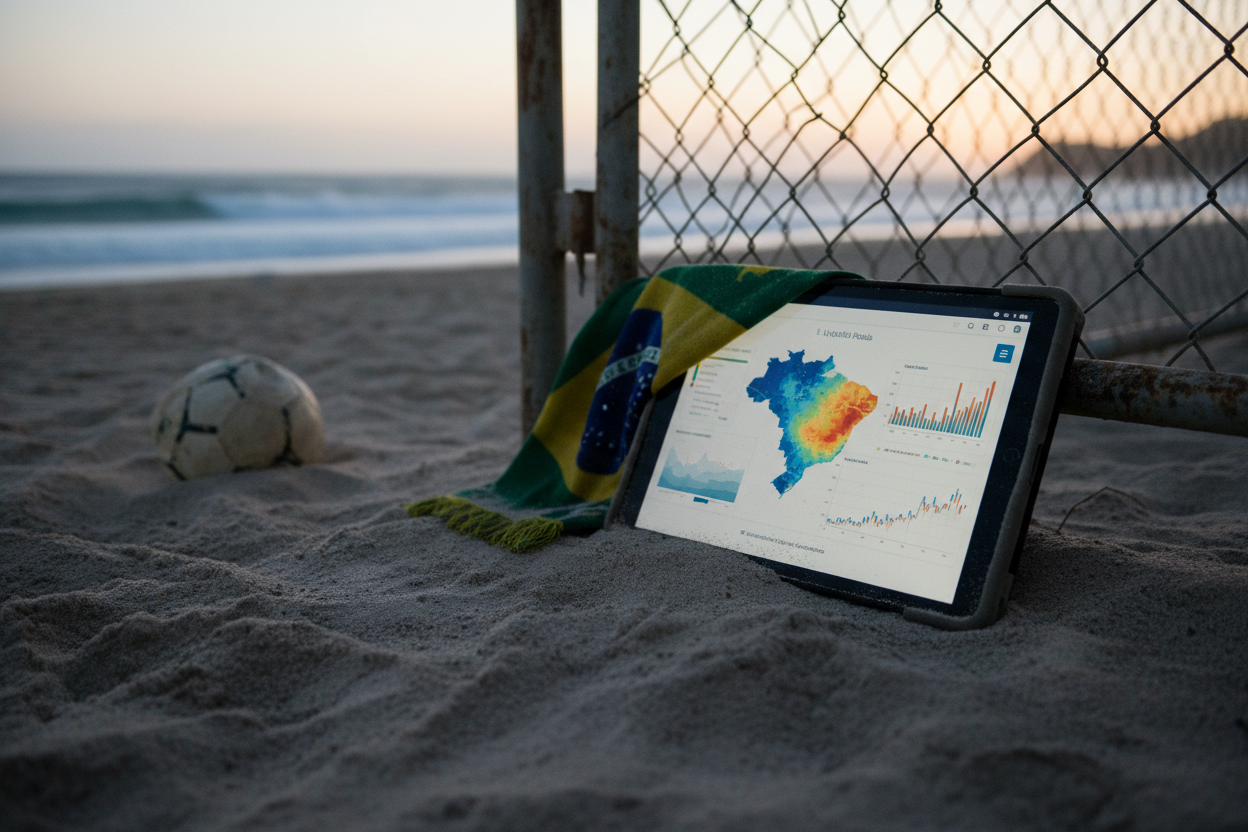
Brazil's decentralized finance landscape is heating up, with BRL stablecoin volumes on Sao Paulo DEX pools surging past weekly highs of $238 million as of February 2026. Traders in this vibrant hub are tapping into nearly $62 million in total BRL stablecoin market depth, turning volatility into opportunity through real-time liquidity maps. Yet, beneath the excitement lies caution: rapid shifts in pair dominance demand vigilant risk management.
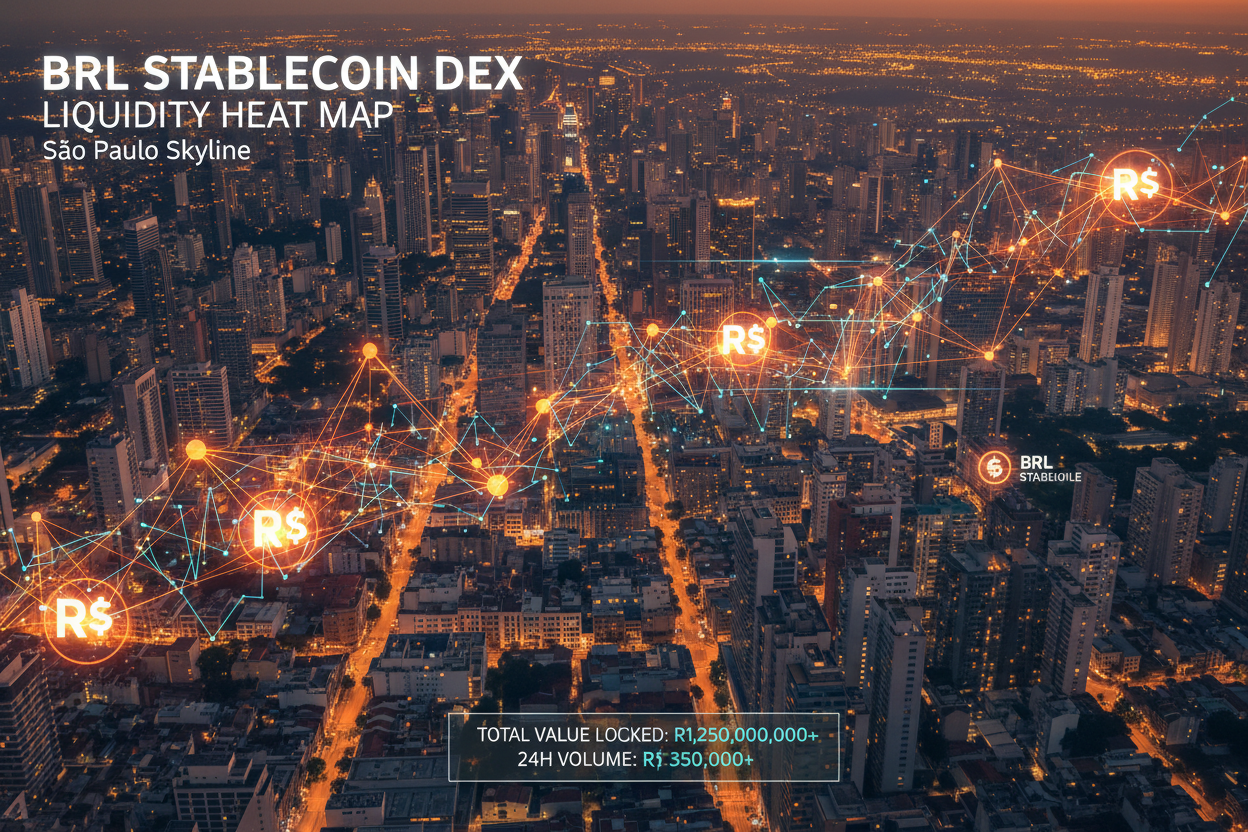
Sao Paulo stands as Brazil's crypto nerve center, where DEX activity mirrors the city's relentless pace. Platforms like NonUSDStableMap. com deliver granular BRL stablecoin maps, spotlighting pools that handle everything from remittances to DeFi yields. Recent data reveals cREAL's CELO-cREAL pair leading with $126 million in cumulative volume, though its monthly DEX trading dipped from a $80 million peak in November 2024 to just $5 million by July 2025. This volatility underscores why professionals prioritize Sao Paulo DEX liquidity metrics over raw hype.

Brazil's Meteoric Rise in Stablecoin Adoption
The numbers paint a compelling picture. TRM Labs pegs global stablecoin transaction volume at $4 trillion by August 2025, with Brazil cracking the top five. Locally, 2025 saw $89 billion in stablecoin flows, dwarfing Africa's totals, per MEXC insights. Fast-forward to 2026, and monthly crypto volumes hit $6-8 billion, 90% stablecoin-driven, eyeing $9 billion by 2030 according to CoinDesk. Superteam Brasil forecasts BRL-pegged assets surpassing R$216 billion, fueled by FX hedges and payments.
This surge ties into broader trends. Brazil's 43% year-over-year crypto activity jump in 2025, coupled with B3's tokenized stock launch, positions it as a real-world asset tokenization frontrunner. Ex-central banker Tony Volpon's yield-bearing stablecoin push aligns with a $299.15 billion global cap and $6.86 trillion monthly transfers. For Sao Paulo traders, these tailwinds amplify Brazil real stablecoin pools, but exposure to fleeting liquidity requires hedging strategies.
Dissecting Top BRL Stablecoin DEX Pairs
Diving into the pools, BRLA emerges as the USD on-ramp kingpin, its BRLA-USDC pair clocking $97.5 million in volume. BRZ holds steady across USD corridors: BRZ-USDC at $15.1 million and BRZ-USDT at $14.7 million. These figures, current as of February 2026, highlight a maturing ecosystem serving payments, remittances, and DeFi access.
BRL Stablecoin Trading Volumes on Sao Paulo DEX Pools (#Millions)
| Trading Pair/Metric | Volume ($M) |
|---|---|
| CELO–cREAL | 126 |
| BRLA–USDC | 97.5 |
| BRZ–USDC | 15.1 |
| BRZ–USDT | 14.7 |
| Total Market | 62 |
| Weekly Volume | 238 |
In my view, cREAL's decline signals a pivot; savvy investors now favor BRLA's consistency amid Brazil's Chainalysis rank-up to fifth globally. NonUSDStableMap. com's real-time tools let users track these shifts, overlaying P2P BRL rates with DEX depths for arbitrage edges. Still, frontier market pros know: high volumes invite slippage during drawdowns.
Why Sao Paulo DEX Pools Matter for Risk-Adjusted Plays
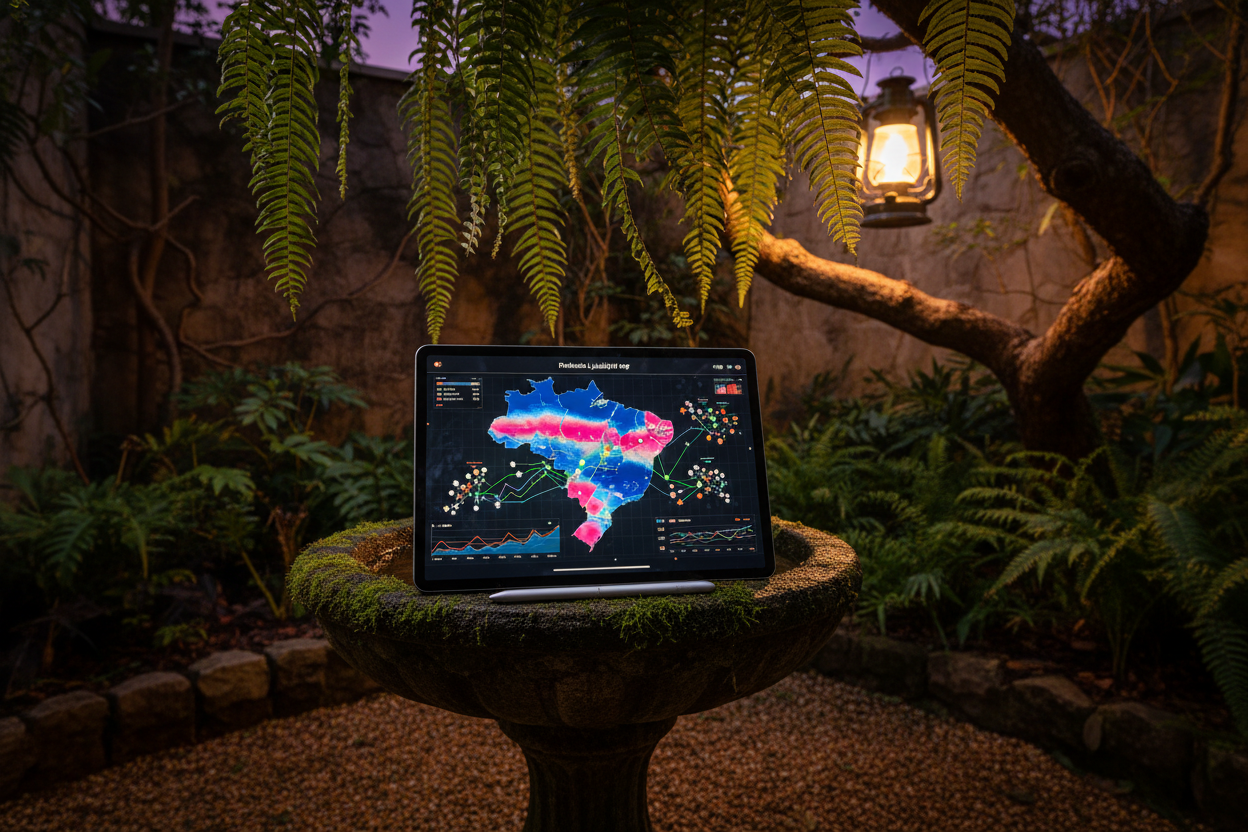
Sao Paulo's DEXs aren't just volume magnets; they redefine frontier access. With stablecoins powering 90% of Brazil's crypto flows, pools here bridge fiat ramps to global DeFi. Weekly $238 million turnover reflects remittance-scale utility, yet cREAL's post-peak fade reminds us of concentration risks. Platforms mapping this offer heatmaps of BRL stablecoin volumes, revealing Sao Paulo's edge over Rio or nationwide averages.
NonUSDStableMap. com's interactive BRL stablecoin map equips users with these insights, layering DEX depths alongside P2P BRL rates for spot-on arbitrage. In Sao Paulo, where local exchanges pulse with real-time bids, this fusion turns data into defensive plays against FX swings.
Tether / Brazilian Real Technical Analysis Chart
Analysis by Market Analyst | Symbol: BINANCE:USDTBRL | Interval: 1D | Drawings: 6
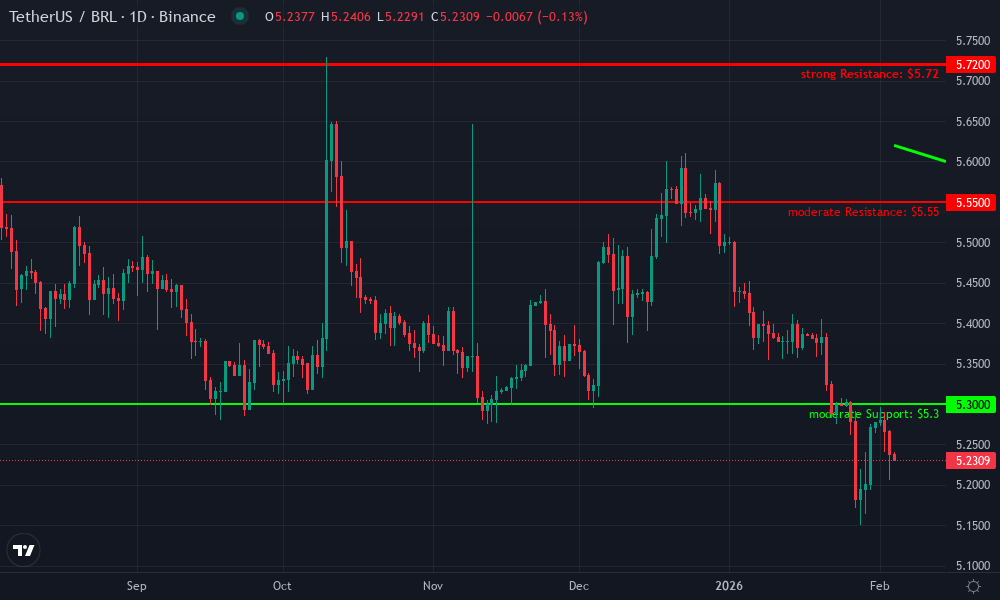
Technical Analysis Summary
As a balanced technical analyst with 5 years of experience focusing on pure price action and indicators, draw the following on the USDTBRL chart to capture the key dynamics: 1. Trend_line for the downtrend from 2026-10-15 at 5.72 (Oct high) to 2026-12-18 at 5.02 (Dec low), marking the initial BRL strengthening phase. 2. Trend_line for the emerging uptrend from 2026-12-18 at 5.02 to 2026-02-04 at 5.62 (recent high), showing recovery momentum. 3. Horizontal_line at 5.02 (strong support), 5.30 (moderate support), 5.55 (moderate resistance), and 5.72 (strong resistance). 4. Rectangle or date_price_range for consolidation zone from 2026-12-20 to 2026-01-20 between 5.02 and 5.30. 5. Arrow_mark_up at 2026-02-01 for breakout above consolidation. 6. Callout on volume spikes during up candles in Jan-Feb for bullish confirmation. 7. Arrow_mark_up on MACD panel for late Jan bullish crossover. 8. Text or callout labels explaining each with confidence levels and risk notes. 9. Long_position marker near 5.55 entry with stop at 5.35 and target 5.80. This setup highlights the reversal pattern in line with Brazil's stablecoin surge context.
Risk Assessment: medium
Analysis: Clear structure with strong support at 5.02 and bullish indicators, but overhead resistance at 5.72 and forex volatility from Brazil stablecoin news introduce uncertainty
Market Analyst's Recommendation: Favor longs on pullbacks to 5.55 with stops below 5.35; scale in per medium risk tolerance, target 5.80 initially
Key Support & Resistance Levels
📈 Support Levels:
- $5.02 - Major swing low in Dec 2026, tested multiple times strong
- $5.3 - Mid-Jan bounce level within consolidation moderate
📉 Resistance Levels:
- $5.72 - October 2026 high, key overhead barrier strong
- $5.55 - Recent Feb high before pullback moderate
Trading Zones (medium risk tolerance)
🎯 Entry Zones:
- $5.55 - Break and retest of recent resistance, aligned with uptrend and MACD bull cross medium risk
🚪 Exit Zones:
- $5.8 - Measured move extension from consolidation height, near 1.618 fib 💰 profit target
- $5.35 - Invalidation below uptrend support and recent lows 🛡️ stop loss
Technical Indicators Analysis
📊 Volume Analysis:
Pattern: Bullish expansion on up candles
Volume rising on recent advances from Jan 2026, confirming buyer interest vs declining on downs
📈 MACD Analysis:
Signal: Bullish crossover
MACD line crossed above signal line in late Jan 2026, histogram flipping positive
Applied TradingView Drawing Utilities
This chart analysis utilizes the following professional drawing tools:
Disclaimer: This technical analysis by Market Analyst is for educational purposes only and should not be considered as financial advice. Trading involves risk, and you should always do your own research before making investment decisions. Past performance does not guarantee future results. The analysis reflects the author's personal methodology and risk tolerance (medium).
Hedging Volatility in Brazil Real Stablecoin Pools
Frontier markets like Brazil reward the prepared. With total BRL stablecoin market depth nearing $62 million, Sao Paulo DEX pools offer a buffer against the Real's notorious gyrations. Yet cREAL's slide from $80 million monthly highs to $5 million lows exposes the peril of over-reliance on single pairs. BRLA-USDC's $97.5 million volume stands as a steadier pillar, channeling remittances and DeFi inflows efficiently. BRZ pairs, at $15.1 million and $14.7 million respectively, provide diversified USD gateways amid $238 million weekly surges.
As a risk manager eyeing NGN parallels, I see Brazil's ecosystem maturing through diversification. TRM Labs' top-five ranking and Chainalysis' fifth-place leap signal institutional inflows, but 90% stablecoin dominance per CoinDesk amplifies tail risks. B3's 2026 tokenization rollout could supercharge Brazil real stablecoin pools, blending stocks with on-chain liquidity. Traders should pair DEX exposure with P2P hedges, targeting spreads where Sao Paulo liquidity outpaces national averages by 20-30%.
Real-Time Tools for Sao Paulo DEX Liquidity Edges
Picture monitoring CELO-cREAL's $126 million legacy while pivoting to BRLA's ascent - that's the power of dynamic maps. NonUSDStableMap. com visualizes Sao Paulo DEX liquidity via heatmaps, flagging pools ripe for yield farming or swift exits. Weekly $238 million volumes underscore remittance rails outpacing traditional wires, yet pros calibrate positions to avoid cREAL-style traps. MEXC's $89 billion 2025 benchmark, now eclipsed, hints at $20 billion-plus surges by year-end, per LinkedIn reports.
Volpon's yield-bearing innovations align with global $299.15 billion capitalization and $6.86 trillion monthly flows, tempting higher-beta plays. But caution prevails: DeCripto's tax net and 43% activity spikes demand compliant, low-slippage execution. In Sao Paulo, where crypto mirrors urban hustle, mapping tools reveal pockets of depth - BRZ-USDT at $14.7 million shines for quick USD swaps amid volatility.
For Nigerian investors venturing cross-market, Brazil's playbook offers lessons in scale. BRL-pegged assets eyeing R$216 billion emphasize FX and transfers, much like NGN stables battle naira woes. Prioritize pools with sustained depth; rotate from fading leaders like cREAL toward BRLA's reliability. These strategies yield risk-adjusted edges, transforming $62 million markets into resilient portfolios.
Sao Paulo's DEX scene thrives on such precision. With stablecoins fueling Brazil's tokenization lead and $9 billion monthly horizon by 2030, liquidity maps become indispensable. Track BRL stablecoin volumes live, hedge P2P variances, and let data dictate moves in this high-stakes arena.

No comments yet. Be the first to share your thoughts!